It’s the resonating message — not just money or “ground game”
Yesterday while researching some links to apply to the article about term limits in Illinois, we came across this article at U.S. Term Limits. It is one of their bread and butter articles titled: Myth-busting 101: Are Elections the Best Term Limits?
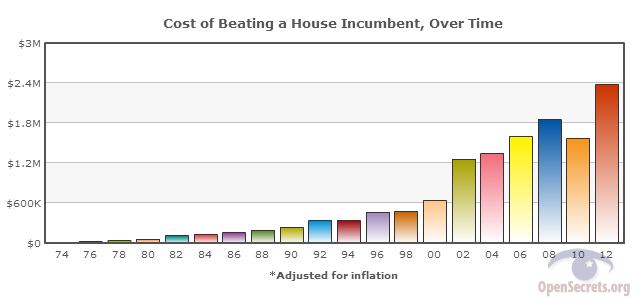
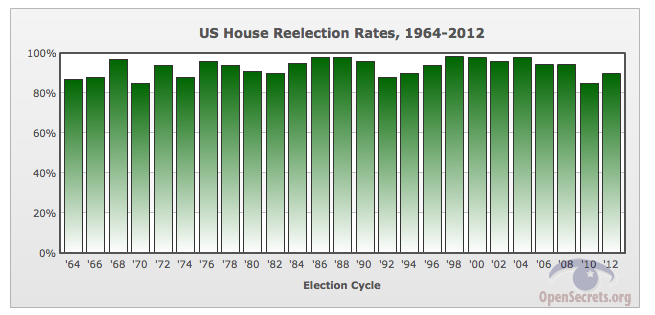
That article makes many useful points and the chart appended below was particularly useful in making the point about term limits being a counterbalance to the overwhelming ability of incumbents to raise money and remain in office. Notice the cost to defeat an incumbent dip from the trend. Note also from the second chart that in the last forty years the reelection rate for incumbents averaged almost 94% with a dip down to 85% in 2010 but back up to 90% in 2012. That chart is from opensecrets.org * . Both correspond to 2010 – the Tea Party year.
So the retaking of the House by Republicans in 2010 corresponded to incumbent election problems (relatively speaking) even more than the 94 Gingrich revolution AND to a significant off-trend in what it cost to beat incumbents. The year 2010 was the first year for the Tea Party intra-party movement. That it was a relatively inexpensive achievement benefiting Republicans we did not realize so starkly. The idea that conservatives will lose unless they raise more money is not born out by the amalgamated statistics.
We think the dips relate in part to big donors not ponying up for conservatives — but Republican conservatives winning anyway. It also suggests ideology and “throw the bums out” was in play more than any other midterm, more so then the liberal Watergate babies that brought liberal Democrats into control in that party forty years ago (Democrats were already in control of the House as a party). We accept that non-candidate and non-party spending is relatively significant and the full picture benefits knowing those relative levels.
Our instincts tell us that the charts do not lend much credence to the expensive bland party ground games being pushed especially if they are at the expense of issue motivation. Issue groups emphasize reasons to vote, the threat of the other guy (2010). To the extent that they are active, they push reasons to turn out, their adherents motivate themselves to figure out whether, where and when to vote. Party’s have little effect knocking doors if there is little to say or exemplify or they propose only bland generic motivations. In 2012 the Romney ground game was good enough had it been inspiring enough.
Lending credence to our view, we believe, is this article in the New York Times Bursting the Democrats’ Midterm-Turnout Bubble. The Democrats are hoping that their turnout models will save the day for them in spite of the unpopularity of their president and their programs right now. Jim Geraghty writing at National Review brought the article to subscribers attention in his Morning Jolt column. Unfortunately we cannot find a link to his newsletter other than offering subscription information. The article refers to political scientists and campaign operatives views that “Obama’s impressive ground operation was worth less than one point in his presidential elections.” Neither we nor Geraghty maintain that 1% cannot be significant, but it does not explain Romney’s loss.
R Mall
* as it turns out both charts are from opensecrets.org, U.S. Term Limits referring to them as well.


