
The chart below came in over the transom from reader RD. It was part of an article from the Institute for Justice. The organization has the important purpose of: “engaging in cutting-edge litigation and advocacy both in the courts of law and in the court of public opinion on behalf of individuals whose most basic rights are denied by the government. Our four pillars of litigation are private property, economic liberty, free speech and school choice.” The chart was associated with an article related to free speech concerns triggered by criticism and calls for controls on political spending, implying the amount is subversive. It is a compelling article and we commend it to you and have added the organization to our blogroll as well.
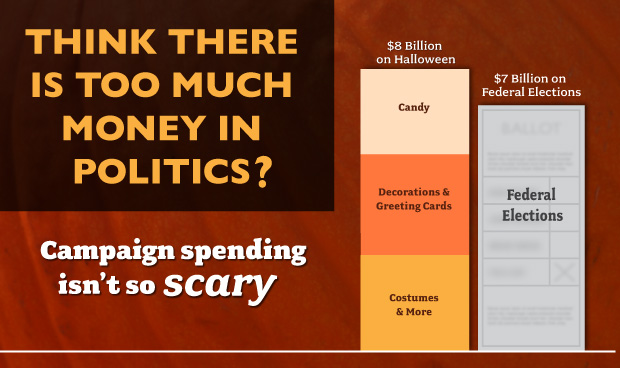
Institute for Justice Graph
Paul Sherman Institute for Justice Senior Attorney explained:
“During the entire 2012 election cycle, Americans spent about $7 billion on political campaigning, but that is less than the $8 billion Americans spent that same year celebrating Halloween. The surprising fact about money in politics isn’t that Americans spend so much money on political campaigning, it’s that we spend so little compared to what we spend on things like candy corn and fake vampire teeth.”
Embellishing an already insightful article we would add that federal elections, which the chart refers to are generally considered on a two-year basis with the presidential as one, and “off-year” as the other.
The 2012 election was a presidential cycle election and they tend to have considerably higher spending than the interim election cycle like we are in now. These are essentially two-year spending patterns with little spent in the even-numbered year of the cycle so the 2012 spending cycle was largely what was spent in 2012 as IJ reports. Keep in mind that the article refers to official campaign party and political action committee spending.
But what about other spending from issue groups apart from parties, candidates and registered PACs? Believing they are not counted in the IJ figures let us guess the amount and double the figure, making the presidential cycle spending something on the order of $14 billion associated with the election directly or indirectly. After all, they are part of the totality of what is experienced by the electorate.
But now keep in mind that Halloween spending is every year so comparing time period to time period we double the $8 billion figure for Halloween and we have $16 billion for the same period. Non-presidential cycles typically experience less spending but presumably not so for Halloween which let us assume trucks along at $8 billion or so a year. So for a four-year political cycle we might see not $28 billion in spending but more like $$24 billion or less for federal races.
Halloween if the rate does not change dramatically up or down might be on the order of $32 billion for a similar period. Now add in a couple billion dollars a year for state and local campaigning to the federal spending of $24 billion for the same period and we are at a rough equivalency for all political spending with just Halloween spending.
We agree with IJ that the spending on electoral politics is not so spooky – what is horrifying is the amount and what the elected politicians do with all the tax money they collect. R Mall