
- Economic – a horrible record
- Political – that’s the good news – next post
Thanks to Hugh Pries for the initial related forward of several Federal Reserve Bank of St Louis graphs of economic indicators, some of which are shown here.
On Obama’s claimed signature achievement, making health care affordable this graph shows the trend since the implementation of Obamacare: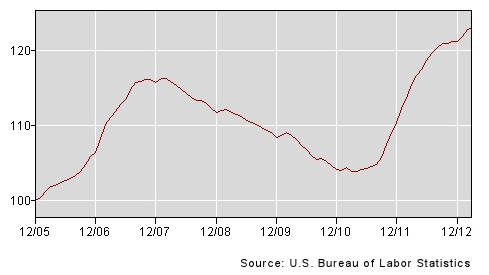
Some other important indicators of economic health and vibrancy: Note if the graphs are too fine for ease of reading try moving them to your picture viewer and that might automatically expand them to full page size or allow zooming.
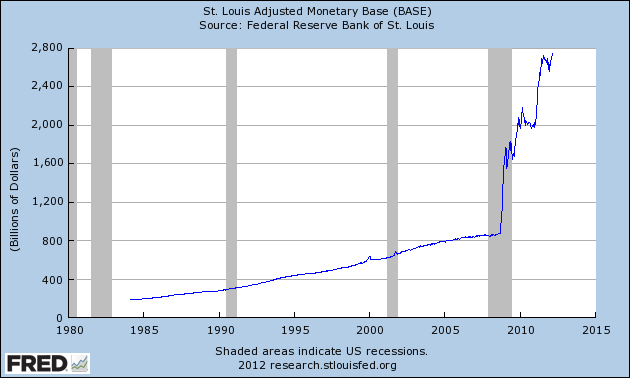
Money printing “quantitative easing” in Obama’s unending practice, to allow for continued bailouts and payoffs, definitely not to accommodate economic growth, as that has been anemic (see other graph and links below) continued long after Bush recession. Obama’s election made maters worse.
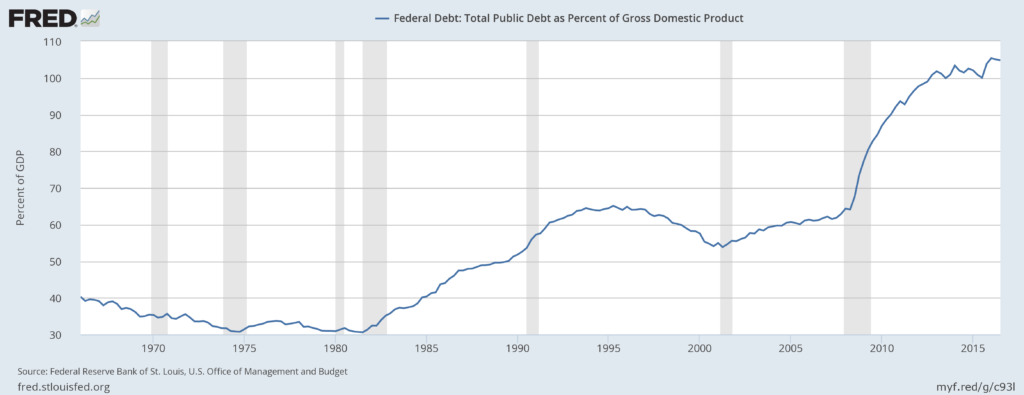
We didn’t make these graphs up. Federal debt as a percent of gross domestic product. Trend intensely aggravated under Obama.
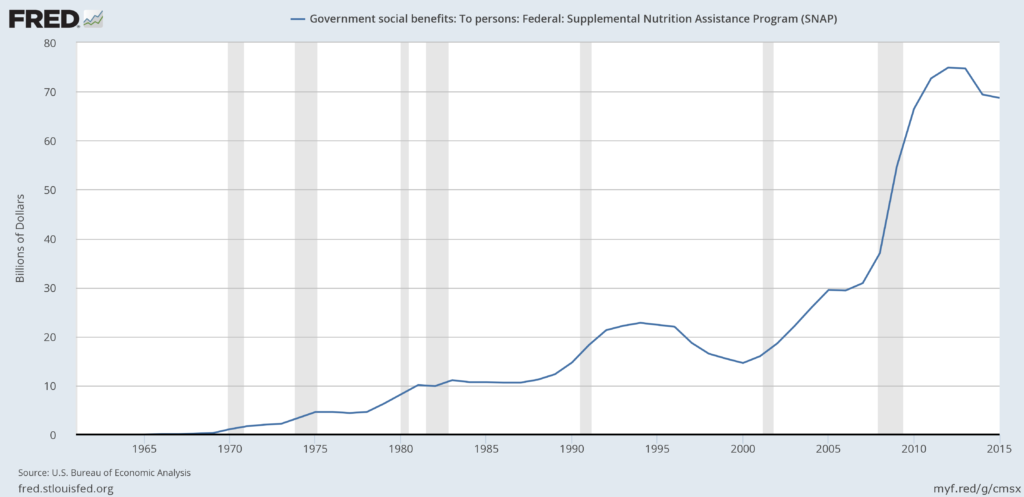
Food stamps under Obama, the great provider, as if that is what America needed.
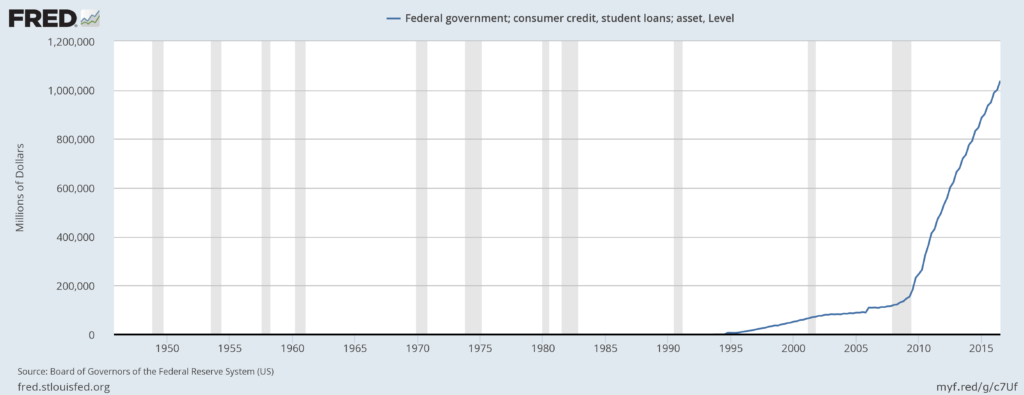
Student loans. The future is theirs sayeth Obama, no jobs though in his tenure, just debt and expensive indoctrination in government dependence.
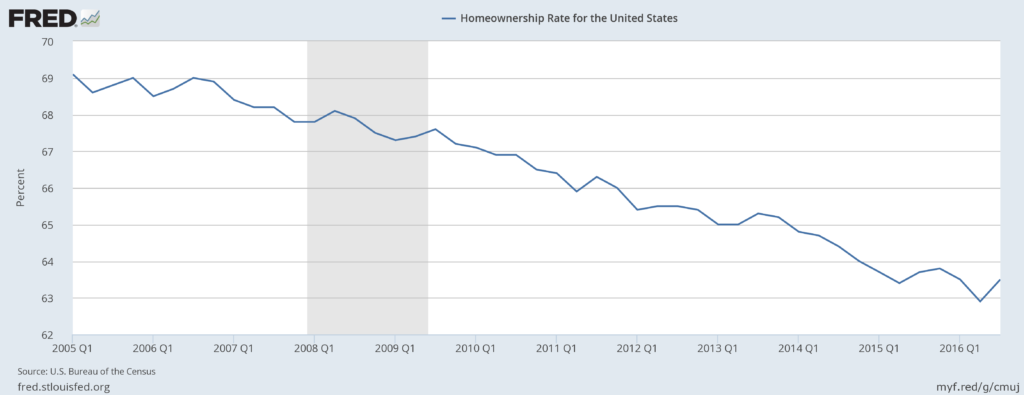
Home ownership rate, a result of all those jobs from the vibrant economic recovery under Obam
Labor participation rate. Obama’s spinmiesters say this is due to baby boomers retiring, except many took early retirements with the economic writing on the wall and layoffs late in their career. It also pertains to full time employment which is affected by the rate of those having to take part-time jobs (the under-employed) but no longer counted or looking. Obama cannot claim success with an unemployment rate when it is based on labor participation. If participation goes down the relative unemployment rate of those officially still counted as looking is skewed up and can show anemic growth. We also have high levels of illegal immigration. That induces lower labor participation as jobs are filled and less is available for those officially counted as looking (illegals are not counted as looking). In other words Obama is content with the employment of illegals however adversely it affects employment rate of citizens and their participation rate. Related reading http://freebeacon.com/issues/obama-economy-9-9-million-employed-14-6-million-left-labor-force
As to the graph below, keep in mind that 2% is a bad thing.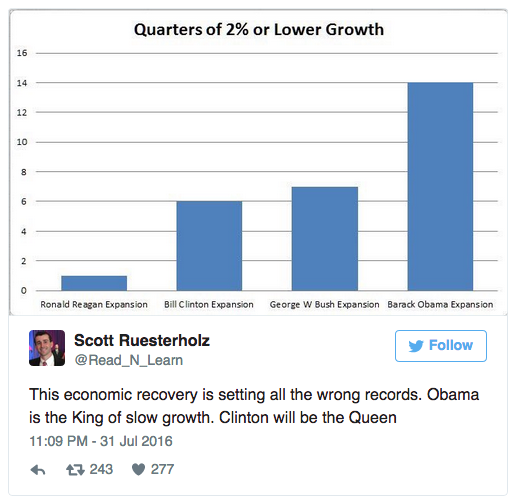
Via The Daily Wire:
The above graph is compounded by the fact that the Department of Commerce reported on Friday that economic growth was a meager 1.2 percent in the second quarter.
Overall, the real GDP growth rate for the Obama economy has been right at two percent–the worst economic recovery since World War II, according to the Congressional Research Service. There has not been a single year under Obama in which the annual growth rate has been at three percent, which is unprecedented for an American president.
More reading on the topic: 7 Facts That Show Obama’s Economic Recovery Has Been AWFUL
R Mall